A little over a month ago we released our first article together where we detailed the Leafs powerplay. We got such a great response and had so much fun putting the project together that we decided to do another project. The obvious next step would be to look at the penalty kill, but someone (Olivia) (Edit: Shawn delete this!) didn’t want to do that. Instead, we chose to research the Leafs breakouts. While we are only a third of the way done, we had the itch to write about it given that we just finished tracking Babcock’s games as head coach, and that the playoffs are starting this week.
We wanted to track breakouts that were more “systematic”, so we put together a few rules. The breakout must start below the exit line, which we determined to be a horizontal line between the two defensive zone faceoff dots. The puck cannot be brought below the exit line by the Leafs themselves, and instead must be the result of an entry, rebound, turnover, or faceoff. Finally, there must be at least one opposing player forechecking below the exit line.
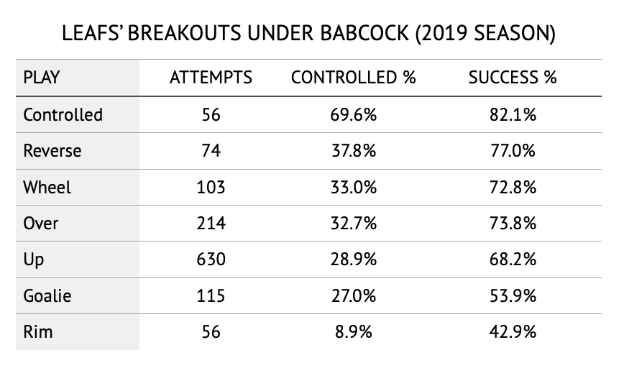
Below is a breakdown of these exits in games coached by Mike Babcock (Through the game against Vegas on November 19, 2019):
It wasn’t a surprise to us that the Leafs’ most successful breakout play under pressure was the controlled exit, due to the way we defined this exit play. A controlled exit attempt was one where the player skated the puck from below the exit line with the intent of carrying it out. Usually, an exit that would be labeled “controlled” was one where a player had already taken significant strides towards the blue line, likely seeing that there was a clear lane to skate the puck.
Other than the controlled play, something that stands out is the “rim” exit play not only being the least successful play, but also by far the play where they exited with the least control. This is understandable again, as the puck is extremely difficult to corral as a winger along the boards when a defenseman rims it. It is interesting that even the goalie exit play (the goalie must make an actual pass or move the puck, rather than just stopping the puck and leaving it) was both more successful and resulted in a higher percentage of controlled exits.
By far the most used exit play under Babcock was “up”, or simply moving the puck up ice. This included both short breakout passes to wingers on the boards as well as stretch attempts. Compared to exit plays that were more horizontal in nature, such as the reverse, over, and wheel, the up was both less successful and resulted in less controlled exits. Comparatively, the Leafs did not reverse the puck often, but it was more successful and efficient than all plays excluding the controlled play.
We also wanted to look at player-level metrics to see who was more or less successful under Babcock. Of course, we still need to acquire the data under Keefe to compare the two. We split player-level exit data into two – start and exit. We recorded who started the exit attempt and assigned the success of the entry to them in one category, and we recorded who performed the actual exit event and assigned it in another category. The latter is a more conventional view of exit metrics, but looking at success by who started exits can give us a better idea of defensemen or centers “making a good first pass.”
Unsurprisingly, the players tend to group by position looking at them in a traditional sense. A few things do stick out though. Trevor Moore controlled 30 of his 47 exit attempts and only failed to exit the zone 5 times. Additionally, Mitchell Marner was also the second-worst forward in terms of controlled exit percentage, just above Nicholas Shore. And perhaps not as surprising was Justin Holl separating away from the defensemen into the group of forwards. He loves to jump past the first layer of forecheckers and join the rush which will lead to more carry-outs.
Looking at players who start exits, we get a more interesting looking chart.
The wingers have very few attempts, and therefore more volatile numbers. Two players that do start exits frequently do stand out from the rest. Exits that Auston Matthews started led to controlled exits about 10% more than his center peers in John Tavares and Alex Kerfoot. This may be aided by quality of teammates, specifically Nylander. Perhaps we should look at exit networks at the end of this project. The other standout is Travis Dermott. While he didn’t stand out in the conventional exit metrics, he is slightly better than his peers when looking at starting exits. Dermott has been one of the more confusing players over his first three seasons as he has had average-to-good on-ice results but hasn’t passed the eye test to others.
Hopefully you enjoyed this little peak into our project and we look forward to sharing our final findings with you in the coming months.
Special thanks to all of the resources we either directly used while working on this project, or helped drive our curiosity. That includes Evolving Hockey, Natural Stat Trick, Moneypuck, and Hockey Viz. We also reference the 2018-19 season as 2018, and 2019-20 season as 2019, because of the game ids.
Introduction
Four scores and seven years ago, or at least that’s what it feels like, the NHL season came to a halt. March 11th was the last time we were able to watch a live game, although it’s debatable how lively a Kings-Senators matchup is. With our schools heading into spring break, followed by moving online, we were about to have some time on our hands. We decided that in order to keep ourselves sane, we must start a project.
We threw around a few ideas, but our choice would be obvious. Between the 2018 and 2019 seasons, the Maple Leafs switched powerplay coaches from Jim Hiller to Paul McFarland. This was a catalyst for change, most notably the positions Auston Matthews and Mitchell Marner would play in the 1-3-1 on the top powerplay unit. The two young stars would switch from their strong-side to their off-wing, making them both one-time options. Previous research has shown that shooters generally gain an advantage by shooting on their off-wing. Additionally, one-timers have shown to be dangerous shots as well, relative to other types of shots. The two can be seen as confounding variables given that one-timers are generally taken on a shooter’s off-wing, but shooters also see the advantage on wrist and snap shots thanks to a more advantageous shooting angle.
The very general question we are attempting to answer is: how does this [change] affect the Leafs? While using information that is easily accessible thanks to websites like Evolving Hockey, Natural Stat Trick, Moneypuck, and even NHL.com, we also wanted to look a bit deeper than Sh% and PP%. We wanted to understand how these systematic changes affected the process of how goals, and more importantly shot attempts, came to be. That included, but was not limited to:
Changes in shot locations
Changes in shooter allocation
Changes in passing patterns
Changes in individual play styles
There are also variables outside of the change in handedness on the first powerplay unit that changed year-over-year. We identified zone entries as a variable that we could attempt to isolate, specifically as it pertains to zone time. A variable that we would not be able to control for, but is worth addressing, was the change in personnel. Nazem Kadri, who spent 2018 in the bumper position on PP1, was traded in the summer of 2019. The Leafs would not find his permanent replacement until November when William Nylander was promoted to the first unit under the new bench boss, Sheldon Keefe. Furthermore, to start the season, John Tavares was moved from the net front to the bumper where Kadri was. Andreas Johnsson filled the net-front role prior to Nylander’s promotion in November. Additionally, in order to fill in for an injured Morgan Reilly, Tyson Barrie spent a significant amount of time on the first powerplay unit.
Throughout this report, we analyze the changes between the two seasons, as well as provide our recommendations for the new powerplay coach next season once McFarland returns to the Kingston Frontenacs.
Personnel Changes
Over the course of the 2019 season, there were 11 players who played at least 50 minutes at 5v4. Of them, Tyson Barrie, Alexander Kerfoot, and Jason Spezza hadn’t played for the Maple Leafs the previous season.
Of the three new players, Tyson Barrie was the only one to play a substantial amount of time on the first unit. Barrie had experience as a quarterback in Colorado, playing over 200 minutes at 5v4 in each of his last five seasons there. However, it was clear that he would not take the reins of PP1 in October. Between 2016 and 2019, Barrie aggregated 2 fewer powerplay goals above replacement than his competition in Morgan Rielly despite playing over 300 more minutes.
Alexander Kerfoot also had powerplay experience in Colorado. He spent most of his time on the second unit with players like Colin Wilson and Carl Soderberg. Still, Kerfoot found a way to produce 8 goals and 20 assists in his two seasons with the Avalanche. His 23% shooting percentage should’ve raised questions though. Was it a part of his role, being served a platter of phenomenal pre-shot movement, or was this due to regress?
In comparison to the 2018 season where Spezza played 160 minutes splitting time between the Stars’ first and second powerplay unit, he played over 100 fewer minutes this year on the Leafs’ second unit. Once Nylander was moved up to the first unit, Spezza became the main entry option on the second unit. Spezza, once a star in Ottawa, is at the latter stages of his career. By signing him, the Leafs were hoping to use the skills he still has in the most efficient way possible.
Entries
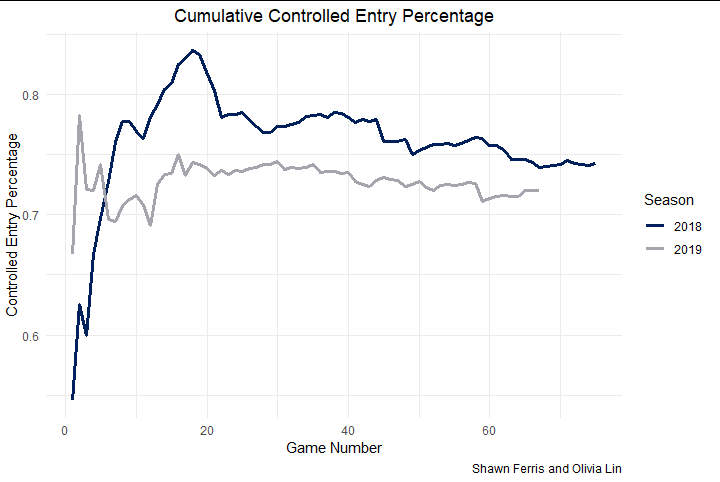
We found it important to track entries for a few different reasons, all of them relating to one another. First and foremost, we wanted to test our hypothesis that the Maple Leafs were better at entering the zone with control in 2018 than in 2019 with controlled entry percentage being our metric of choice. Zone entry to formation and rush shots (ZEFR), which was created by the Colorado Avalanche’s Arik Parnass, is another metric that we could’ve used.
It turned out that our hypothesis was correct. Outside of the first handful of games, the Maple Leafs were slightly better at entering the zone with control last season, however, the change in efficiency is not as big as we thought, equating to about 2 fewer controlled entries per 100 attempts.
The Leafs’ entry strategy in its simplest form begins like the 5 on a die— a box + 1 where the quarterback is in the middle. There are two stretch forwards on either side of the ice and two players behind the QB as drop options. The first common play is the standard drop. The QB carries the puck up the middle until he runs out of room, then drops to the primary drop option. From there, the primary drop option either attempts to enter the zone himself, passes to the stretch player on his strong side, or makes another drop pass to the secondary drop option. The secondary drop option often skates with the QB, then loops back around to make himself available for a pass from the primary option.
Standard drop
Double drop
In some situations, the other common play is the drop and D-to-D play. Once the primary option receives the drop pass from the QB, he makes a D-to-D pass across the ice (instead of a drop pass) to the secondary drop player. This is used usually if there is heavy traffic on the strong side of the ice.
D to D
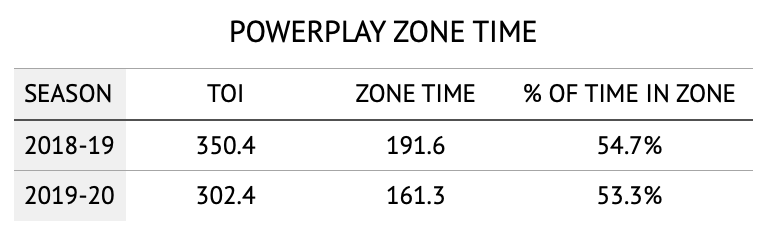
The second reason we wanted to track entries was to isolate shot metrics for offensive zone time. Entering the zone with control is only one variable to the equation here though. Faceoffs, loose puck recoveries, and other miscellaneous plays all play a part. However, if the entries were worse this past season, the percentage of powerplay time spent in the offensive zone should decrease, holding all other variables constant.
As the table above shows, they did in fact spend slightly less of their powerplay time in the offensive zone, but this change was rather minimal. The slight decrease is likely because other factors didn’t stay constant, specifically faceoffs. The Leafs saw an increase in faceoff win percentage year-over-year from 54% to 57%. This may be due to the rule change between the two seasons, allowing teams to pick which dot they wanted to start the powerplay on. In 2018, all three centers on PP1 were left-handed, giving them a disadvantage on powerplays starting on the right dot. In 2019, John Tavares was their preferred centerman, therefore, they elected to start their powerplays at the left dot. They also added a right-handed centerman in November, giving them a faceoff option on the right dot as well, however, he only took 14 faceoffs in 186 minutes.
The minimal changes in zone time lead us to believe that the decrease in unblocked shot attempts per hour from 87 to 73 is almost entirely due to the changes in the offensive zone system as opposed to lower efficiency in entering the zone.
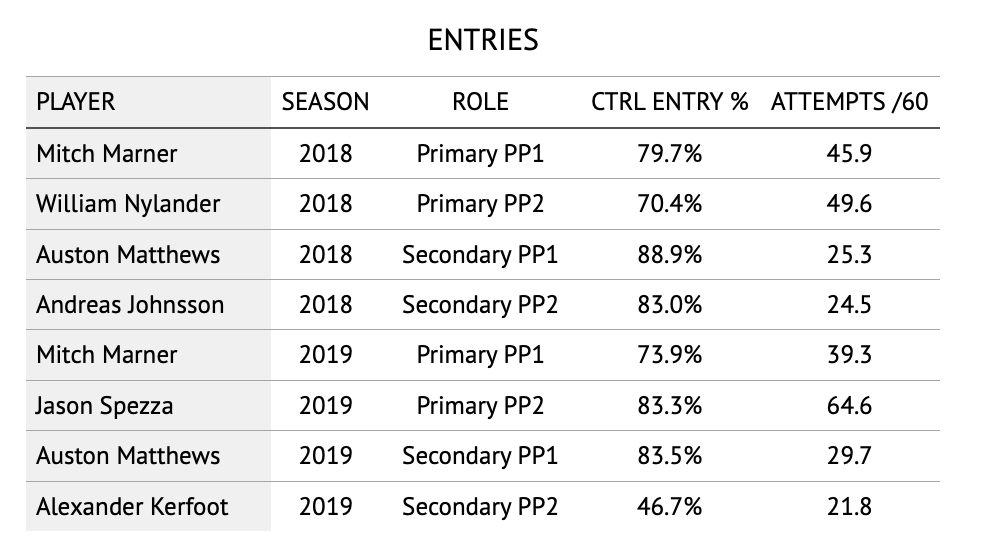
Finally, we (selfishly) wanted to know which players entered the zone more efficiently. We split controlled entries into skating and passing entries in order to better assign credit. Skating entries are quite simple— they were assigned to a player who skated the puck over the offensive blue line with control. However, we expanded passing entries to more than a pass completion over the blue line. If a player receives the puck within a few feet of the blue line and doesn’t have to change directions, that entry would be credited to the passer. Not only did this help assign credit to the player who did the majority of the work, but it also helped with evaluating the primary and secondary options on each unit.
Perhaps the biggest change in entries at the player level was the allocation of entries between the primary and secondary (and even tertiary) options. In 2018, Jake Gardiner actually attempted more entries than any forward outside of William Nylander on PP2. Still, Johnsson and Ennis took their fair share of entries and were successful. This season, Jason Spezza seemed to take far more of PP2’s entries, and converted at a high rate. On the other hand, Kerfoot seemed to struggle. That’s not to say Kerfoot would be a poor entry option moving forward, his 30 entry attempts are a small sample size, but this was a dynamic that made the second unit far more predictable and easier to defend.
As for PP1, Mitch Marner was the primary entry option in both 2018 and 2019. Marner attempted fewer entries per 60 in the 2019 season compared to the 2018 season and controlled them at a lower rate as well. Conversely, Auston Matthews was the secondary option for the majority of both seasons. Even with the Marner injury early in the 2019 season, Nylander replaced Marner as the primary option while Matthews remained the secondary option. Nonetheless, Matthews attempted entries at a higher rate this season and had the highest rate of controlled entries in both seasons. Matthews is obviously a strong entry option with the skill to consistently enter the zone with control. While it’s possible his high controlled entry rate is due to fewer attempts, it could be interesting to see Matthews used more as a primary option, or at least alongside Marner as a 1A/1B type situation to create more entry options and plays.
Shooting Patterns
Now that we have covered zone entries, we will address offensive zone play, which is where the biggest changes occurred. Admittedly, we came into this project already having been familiar with the changes in shooting patterns. As we visited our favorite subscription sites, notably Hockey Viz and Evolving Hockey, throughout the season, we noticed that shot rates were down year-over-year. As we mentioned previously, the rate of unblocked shot attempts per hour dropped from 87 to 73. Furthermore, according to Evolving Hockey, the rate of expected unblocked shooting percentage dropped from 10.5% to 9.0%. Strangely, the rate of goals saw a small increase, igniting our curiosity and forcing us to dig a bit deeper into the intricate details of the team’s shooting patterns.
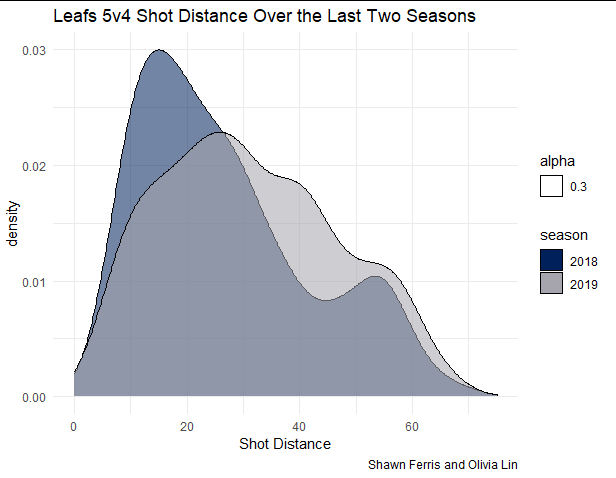
The first aspect we looked at was shot distance. To get this data, we scraped the past two seasons and used the x and y coordinates of the shots to calculate the distance from the shot to the net. The chart below shows the distribution of shot distance between the 2018 and 2019 seasons. It is evident that the Leafs tended to shoot closer to the net in 2018 and with a much more concentrated distribution. With shot distance being the biggest factor in expected goals, the Leafs shooting from farther away likely contributed to the decrease in expected shooting percentage.
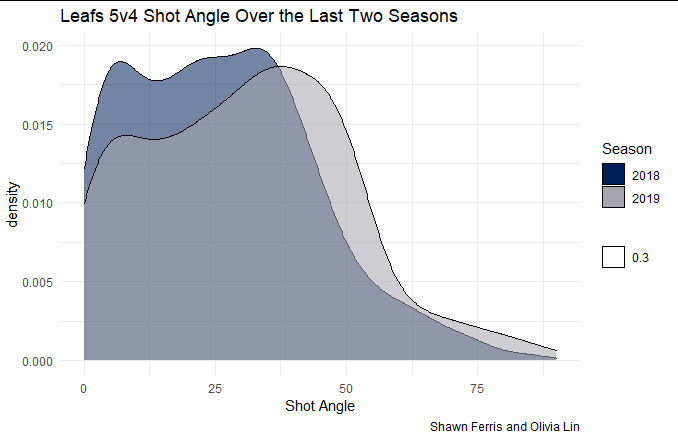
Furthermore, the Leafs were also shooting from slightly wider angles this season. The wider the shooting angle, the less available net, and lower shooting percentage on average.
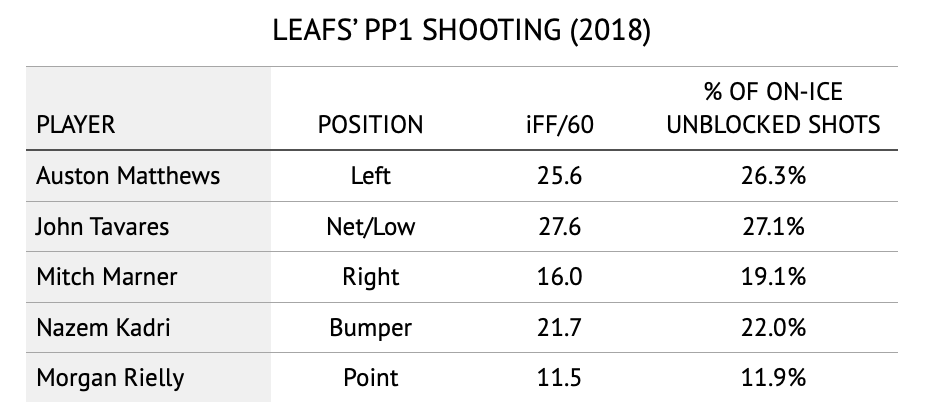
The increase in shot distance, and wider shooting angles, changed in conjunction with the primary shooting options on the powerplay.
*Data from Natural Stat Trick
Please note that for the first powerplay unit in 2019, we designated Tyson Barrie as the point player rather as opposed to Morgan Rielly, who also spent a significant amount of his time on PP1 when he was healthy. Our reasoning for this was that Rielly played fewer minutes on that unit despite the fact that Barrie started the season on the second unit.
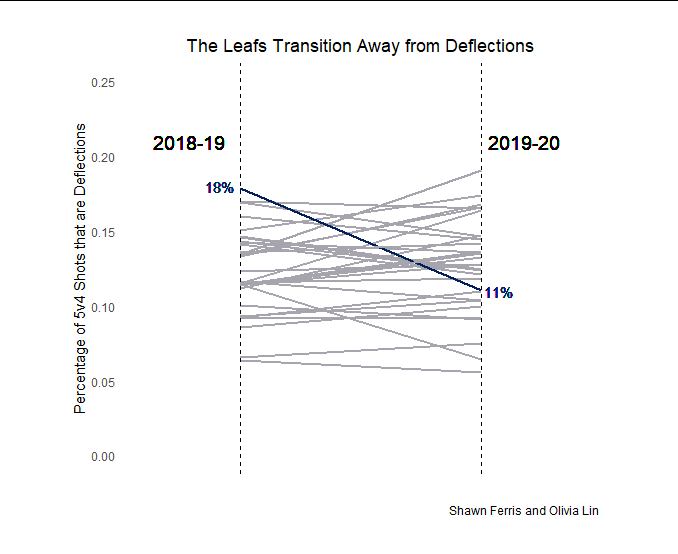
With the shots on the powerplay coming primarily from Auston Matthews this season, the Leafs depended less on deflections from down low or the bumper position. The Leafs went from having the highest percentage of their 5v4 shots being deflections to being middle of the pack in relation to the rest of the league.
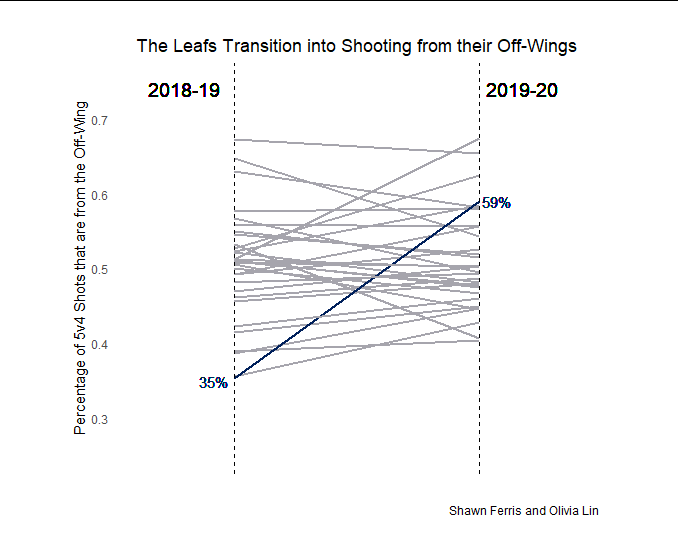
Additionally, with fewer shots coming from net front positions, as well as Marner and Matthews switching sides on the powerplay, the Leafs began to shift those deflections into shots from the off-wing. These changes contributed to the Leafs rising from last in the league in percentage of shots from the off-wing in 2018 to fourth between the two seasons.
Passing Patterns
At this point, we were quite excited to dive into the changes in passing patterns, if there were any. Shot quantity and quality are the results of a process. We have gone over a few different parts of the process already. Successful zone entries are important as the powerplay must obtain the offensive zone in order to create a scoring chance. Zone time, while relating to entries, also captures faceoffs and loose puck recoveries, both important in making sure you do not have to regain the zone often. However, those parts of the process mostly attribute to shot quantity while passing patterns largely affect shot quality, and can help give context to the increased shooting efficiency year-over-year.
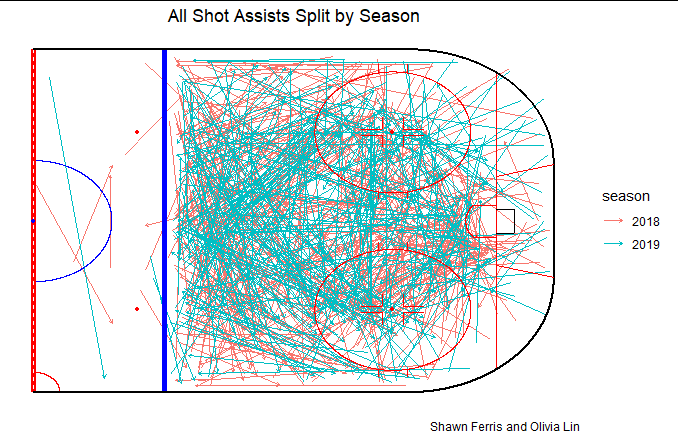
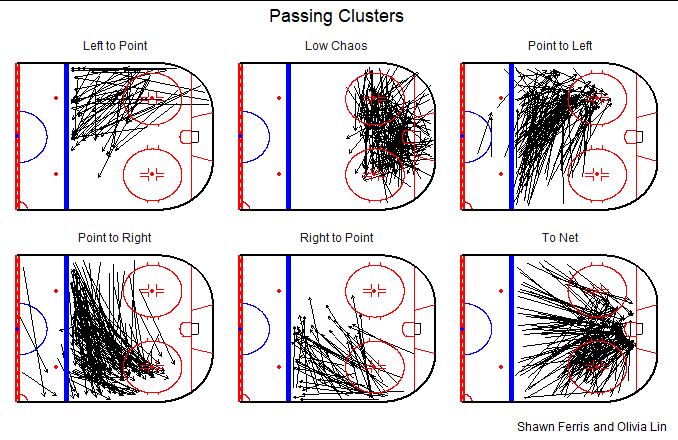
If we were to plot all of the shot assists on one chart, it would look like this:
It’s impossible to gather anything from this, right? In order to help us digest this information, we used k-means to create clusters. Using the x,y coordinates, along with how much closer the new puck carrier is and the change in angle, we were able to form six clusters that satisfied us.
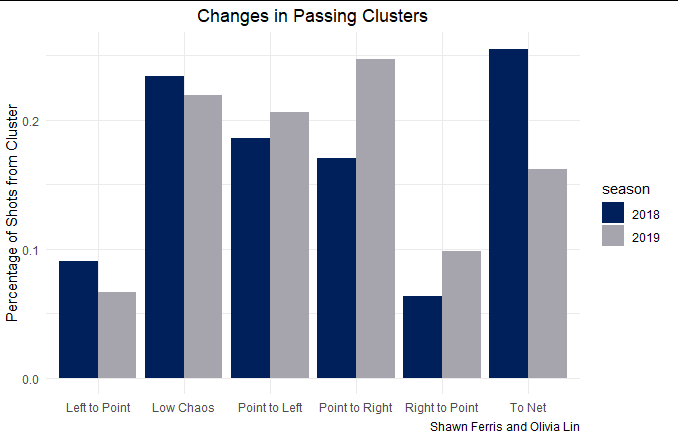
While the clusters are rather broad, we found that would be beneficial in comparing the two seasons given the small sample size. Given the decrease in deflections, along with the increase in shots from the off-wing, we would assume there are far fewer shots in the “To Net” cluster, and that those would be replaced with “Point to (Right/Left).”
And we would be right. Something we did not expect and found quite interesting is that the left-to-point and right-to-point inverted between the two seasons. Given that we only tracked shot assists, there is some survivor bias, but we wonder whether or not the pointmen shoot more frequently after receiving a pass from Auston Matthews as opposed to Mitch Marner.
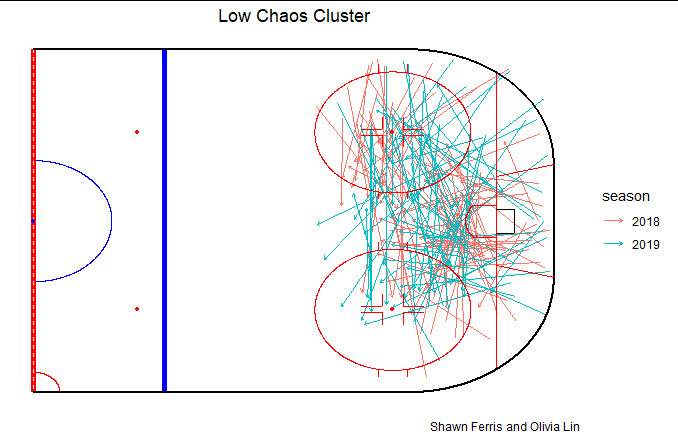
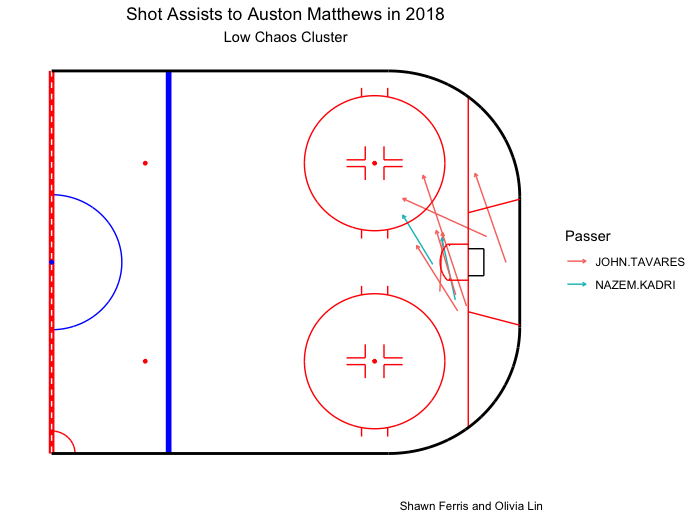
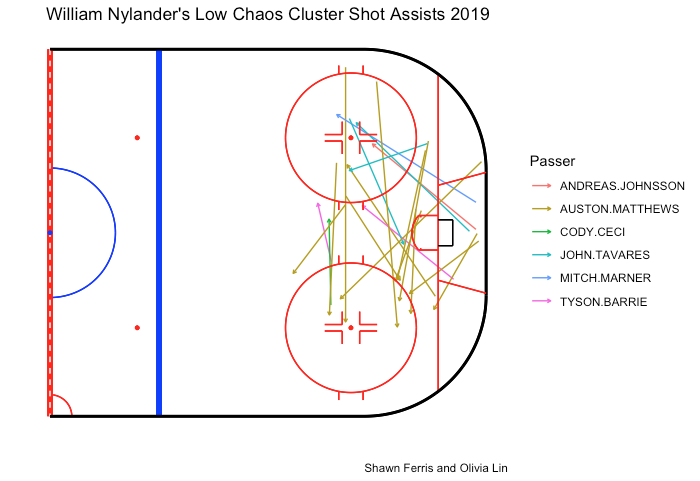
From our observations while watching the games live, as well as while tracking, we felt there was much more cross-ice movement this past season in the low chaos cluster. Given the vertical nature of the 2018 powerplay, it isn’t shocking to see an abundant amount of shot assists in the low chaos cluster, but many of those would be from netfront activations and short passes from the half-wall to the bumper or netfront.
In 2019, 43% of the shots from the low chaos cluster crossed the royal road, a significant increase from 23% in 2018. Even low in the zone, there was far more focus on horizontal movement under Paul MacFarland.
Horizontal movement, specifically royal road passes, forces the goaltender to change positions in order to adjust to the new depth and angle, giving the shooter an advantage. Given the limitations of the NHL’s play-by-play data, this cannot be accounted for in public expected goals models. So while the Leafs may have been taking shots from farther out and wider angles, they were more than making up for it through their pre-shot movement.
Individual Player Changes
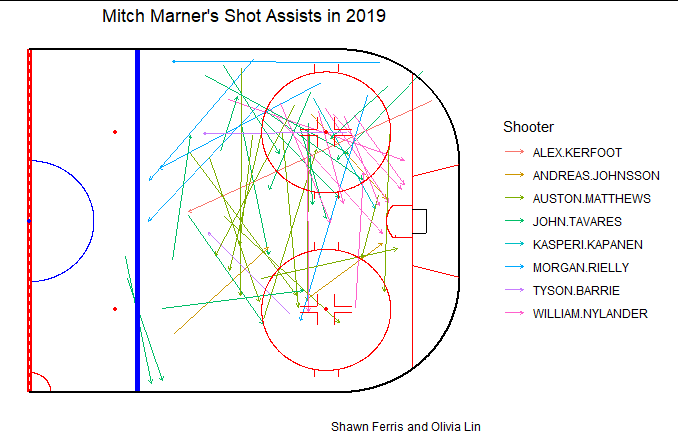
MITCH MARNER
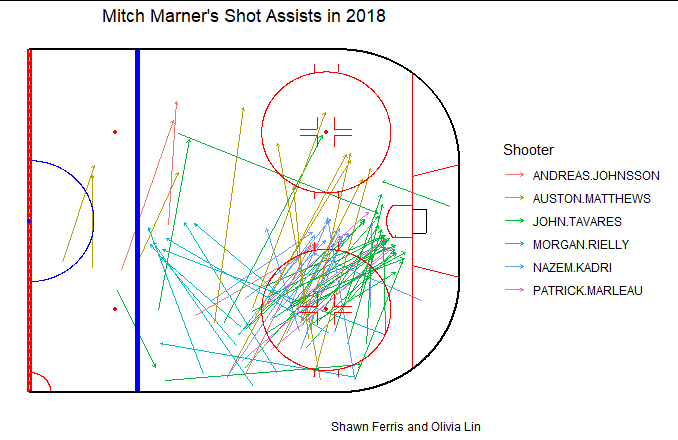
In 2019, Mitch Marner contributed about 6 fewer shot assists per hour than in 2018. This should be expected as many of his shot assists were in the “To Net” cluster that season.
He was essentially the main culprit of the problem. Many of these shot assists were deflections and not the good kind. They were rather weak and wouldn’t hinder a well-positioned goalie. However, not all of the blame can be placed on him. Shooting isn’t Marner’s greatest strength. With the bumper being left-handed, there was no one-time option for Marner to pass to, forcing Marner to either shoot himself, look for a deflection, or pass the puck back to the point.
In 2019, he was much freer, completing passes from all over the offensive zone. While the play down to the netfront guy will never go away, he was able to connect cross-ice passes more frequently this season. Furthermore, his bumper and cross-ice option were now able to be a one-time option, making much better use of his playmaking abilities.
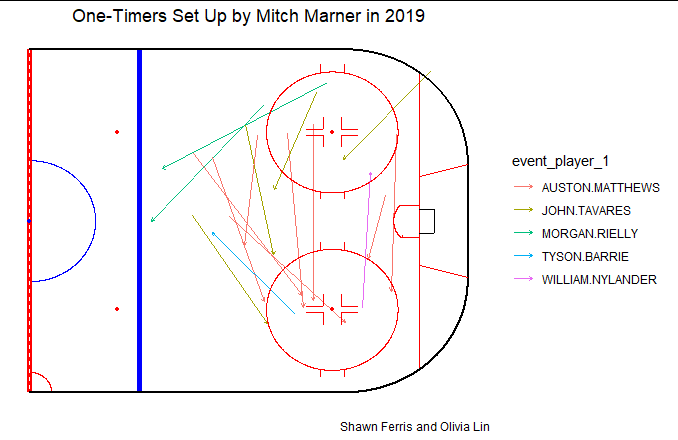
Marner wasn’t able to connect on any one-time passes in 2018 but managed to create 16 in the new set-up. Granted only two of them turned into goals (12.5%), but when evaluating the process, this is a good sign. Marner was able to record primary assists at the same rate year-over-year despite the significant decrease in shot assists per hour thanks to his teammates converting on his shot assists 15% of the time as opposed to 11% in 2018.
AUSTON MATTHEWS
Auston Matthews was very much Marner’s counterpart on the powerplay both years, playing the opposite half-wall. In contrast to Marner’s playmaking role, Matthews is a shooter. Interestingly, although Matthews contributed a higher percentage of on-ice unblocked shots in 2019, he wasn’t necessarily taking shots or receiving shot assists at a higher rate. In 2018, Matthews received 26.0 shot assists per hour, and 26.2 in 2019. Additionally, Matthews’ individual rate of expected goals decreased from 2018-2019, falling from 2.76 to 2.15.
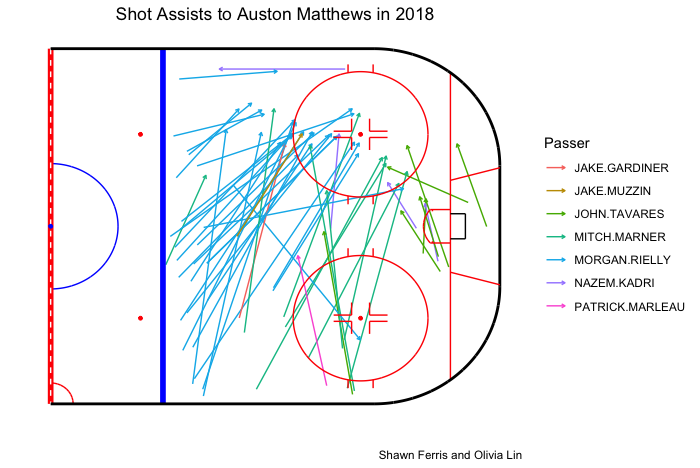
Here is an overview of all shot assists to Auston Matthews in the last two seasons:
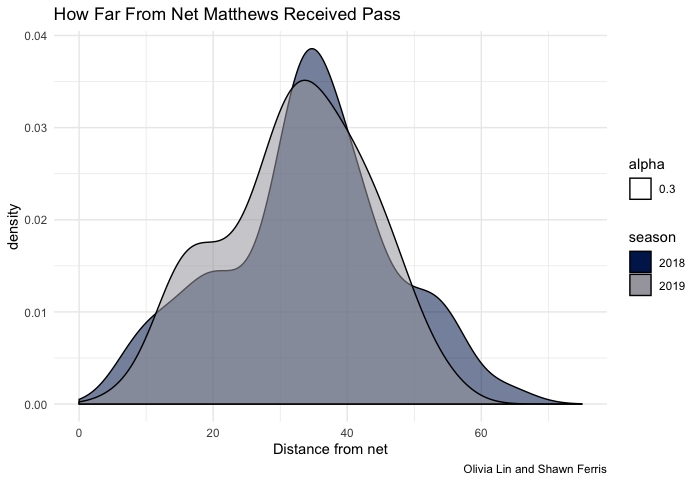
With Matthews switching to his off-wing, shot assists to him were naturally directed towards the right side of the ice in 2019 rather than the left as they were in the previous season. A general observation of the above charts is that while Matthews is still receiving a large number of passes between the top of the circle and the dot, he was receiving more cross-ice passes in 2019. The distance from the net at which Matthews tended to receive shot assists was essentially the same across the two seasons despite the change in position and lower reliance on the point.
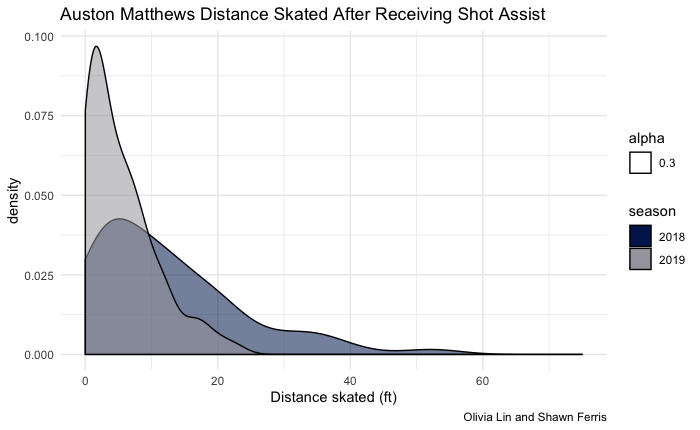
After receiving the pass, though, playing his off-wing gave Matthews in 2019 an advantage in being able to shoot the puck from very close to the same location in which he received the pass. The distance Matthews skated between the location where he received the pass to the position where he shot the puck tended to be shorter in the 2019 season. This change can be attributed to the fact that being positioned on his off-wing allowed Matthews to put himself in a position to receive passes to take one-timers or passes he could catch and release quickly without having to skate and set up, and therefore giving goalies less time to get in position to make the save.
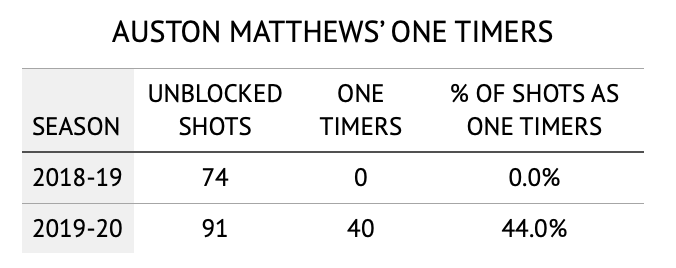
According to the data we tracked, Matthews actually took no one-timers in 2018 at all. However, that can be misleading because declaring a shot to be a one-timer is subjective even if you attempt to define it beforehand. It is possible that if we reviewed all of Matthews shots in 2018, we could conclude that he did take a few one-timers. The point still remains that due to the position he played and the shot assists he received, it is very likely he didn’t take many at all. Switching to the off-wing, as previously mentioned, allowed Matthews to open up for one-timers. This season, Matthews took 40 one-timers, which was about 44% of his unblocked shot attempts. Again, despite the exact number of Matthews’ one-timers perhaps being off, we are extremely confident through the data tracked and our personal viewings that the number of one-timers Matthews took saw a substantial increase.
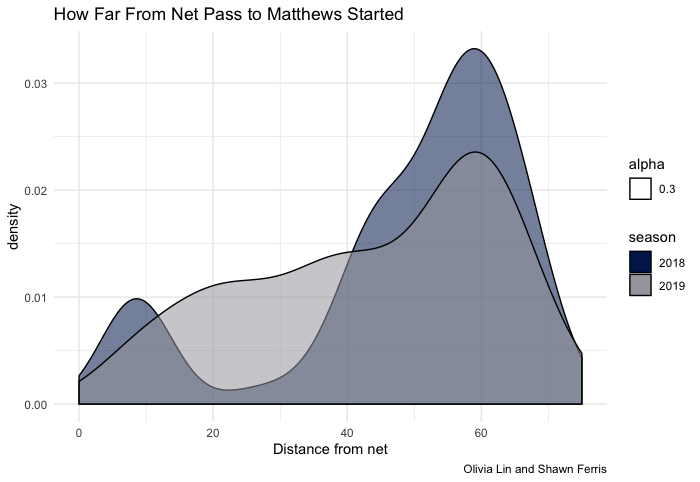
While the distribution of Matthews’ shot assist reception locations did not considerably change between seasons, the distribution of starting locations of shot assists to Matthews did. Most of the shot assists Matthews received in 2018 came from the point, whereas the starting locations of shot assists he received in 2019 were more varied. In 2019, he was receiving more passes that began from down low and closer to the net. Nylander becoming the net front/low player on the powerplay played a big part in that, which we will address later.
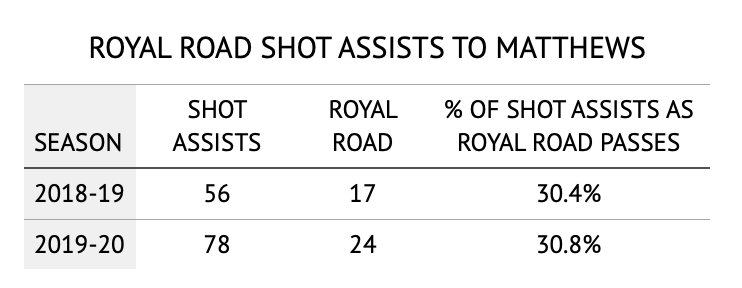
To further investigate the increase in horizontal puck movement to Matthews, we looked at all royal road shot assists first. Even though the actual percentage of royal road shot assists to Matthews did not increase significantly, the total number of royal road shot assists did increase jointly with total shot assists to Matthews.
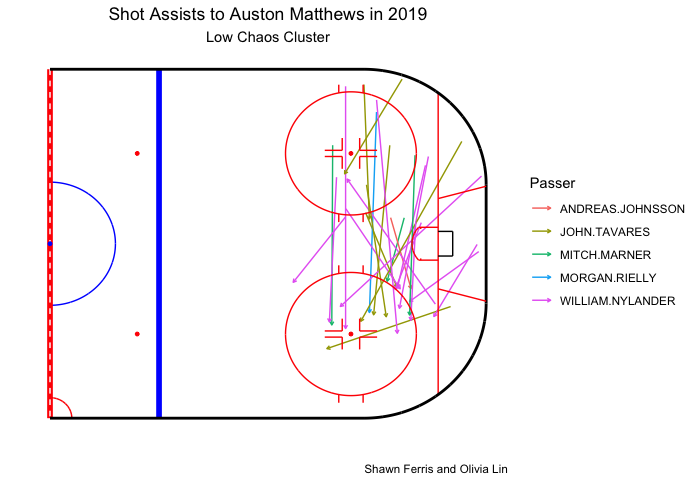
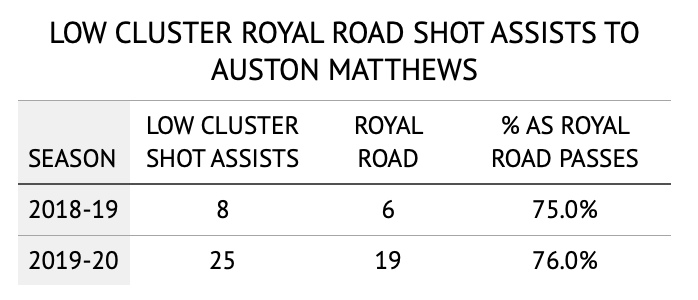
To get more specific from there, royal road passes can be narrowed down to only those in the “low chaos” cluster we previously identified in the passing patterns section.
There is a significant increase in the volume of shot assists Matthews received in the low chaos cluster. It is also evident that the characteristics of these passes Matthews received in 2019 were dramatically different. Rather than short passes beginning close to the net, Matthews received longer, cross-ice passes starting from the left half of the ice, a large number of which were from William Nylander.
The number of low chaos shot assists to Matthews and the number of those that were royal road passes more than tripled between the two seasons. In 2018, the minimal amount of royal road passes Matthews did receive were all on his strong side, making it difficult for him to truly take one time shots. Adding this play to Matthews, who is already a dangerous shooter now playing his off-wing, allowed for more low one-timers off royal road passes. In 2019, Matthews took 10 one-timers off low cluster royal road passes, or 40% of his shots off total low cluster shot assists.
Similar to the general observation we made about the Leafs’ passing patterns, we believe public expected goals models that are unable to account for pre-shot movement do not accurately capture the quality of the shot assists Matthews received in 2019. While his rate of expected goals at 5v4 did decrease between seasons, Matthews was actually taking dangerous one-timers on his off-wing off low royal road passes in 2019 that he wasn’t attempting or getting opportunities for in 2018.
WILLIAM NYLANDER
Auston Matthews receiving more dangerous passes was in a large part due to William Nylander playing the net-front/low position on PP1 in 2019. Nylander excelled in the position because he was both an excellent passer and a scoring threat, second on the Leafs to Auston Matthews in 5v4 goals scored this season. In fact, Nylander scored 8 5v4 goals in 2019, exactly as many as John Tavares did in 2018, in 20 fewer minutes played.
Nylander replacing Tavares elevated the netfront position to more than just a player to whom to funnel passes to, aiming for deflections and shots in-tight. Instead, Nylander was able to turn it into a dual-threat because he was a better 5v4 passer in 2019 than Tavares was in 2018.
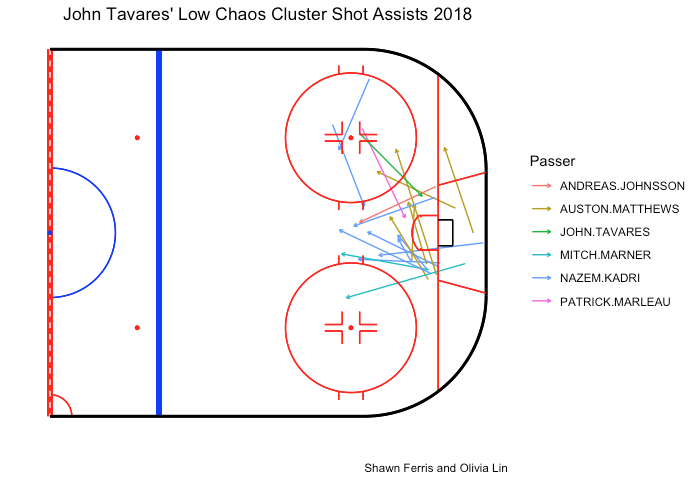
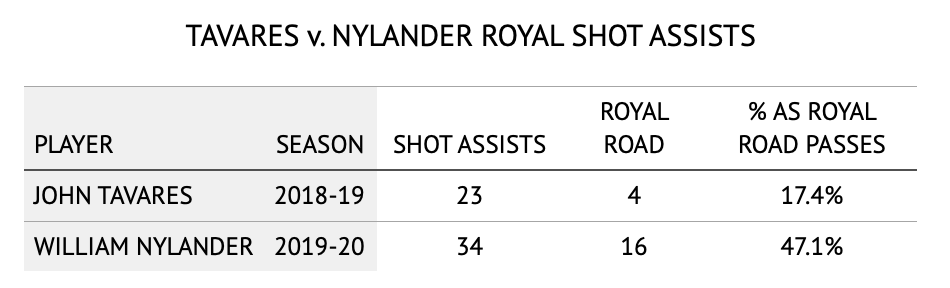
Below is a comparison of their shot assists from the previously identified low chaos cluster:
Nylander contributed shot assists at a higher rate than Tavares, completing 11 shot assists per hour in comparison to Tavares’ 6.7 per hour. Additionally, Nylander’s shot assists were generally more dangerous. While Tavares tended to make short passes from the front or side of the net, Nylander made longer passes that crossed the royal road or passes from behind the net.
When looking at total royal road passes, Nylander made 4 times as many royal road passes as Tavares, nearly half of his shot assists. Even when narrowing it down to just low chaos shot assists, Nylander still completed 14 royal road passes. To compare to Marner, who is considered the Leafs’ best playmaker, Nylander’s 16 royal road shot assists were more than Marner’s in both seasons (11 in 2018, 9 in 2019).
It is also important to note that 11 of Nylander’s 16 royal road shot assists were passes to Auston Matthews. Not only was Nylander making a high volume of royal road passes, but he was also making a majority of those quality passes to a dangerous shooter on his off-wing.
Recommendations
Now that we have analyzed the changes made under Paul McFarland, we have a few recommendations for the incoming powerplay coach. Ryan Stimson is a mentor for both of us and our recommendations are greatly influenced by him. Stimson is a proponent of setting up powerplays from behind the net as opposed to the point. This concept seemed to take the world by storm when the Swiss did this during the 2019 World Junior Championships.
Given Nylander and Tavares both have NHL experience down low on the powerplay, utilizing both players at the same time seems like it can work. The Philadelphia Flyers are a team that has begun to put two guys low instead of a bumper much more frequently. It has lead to some interesting pre-shot movement.
Unlike the Flyers, we believe the focus should be to create pre-shot movement that combines low-to-high and lateral pre-shot movement, or behind-the-net royal road shot assists for the nerds out there.
The Maple Leafs could easily form into an umbrella with two players below the goal line by simply dropping the bumper below the goal line on the opposite side in an activation that is already present. While Nylander could look to find Matthews as he already does, he would be able to switch sides by passing to Tavares, forcing the opposing penalty killers to shift and allowing the Leafs to get creative in their attack.
The open space in the middle of the ice would also allow Matthews to roam in and try to take one-timers from the slot, either from Nylander or Marner. While the Swiss did that effectively, we’d have to see how an NHL penalty kill would react.
Of course, we could take this a step further. We could introduce a new movement by having the pointman take the bumper position that was once occupied by Tavares.
By bringing the pointman down, all five players become scoring threats either directly or within a pass or two. This is a rather aggressive strategy and would certainly lead to more shorthanded offense against, but it may be a risk worth taking while down in games. Powerplays have become rather predictable, so introducing new movements could catch opposing penalty killers off-guard.
In situations where the Leafs need offensive leverage, they may also consider the idea of having a five-forward powerplay unit. Playing Jason Spezza on PP1 would add another highly skilled player who is both a strong shooter and playmaker. Having an extra forward on the powerplay would be beneficial for entries as well. Given Spezza’s high rate of entry attempt and his high controlled entry percentage, it would add another viable entry option. With teams forced to respect Marner, Matthews, and Spezza (and even Nylander) as possible entry options, it would free up the ice and make entries harder to defend.
The current Leafs’ powerplay is more or less static. Even the umbrella and 2-1-2 options that we proposed above are a bit static. The Washington Capitals, Boston Bruins, and others have found success shifting around players within their formation. By adding another forward who is right-handed and has a similar skillset to the other forwards of the same handedness, they can shift around with ease.
As an example, the Maple Leafs could use the 2-1-2 setup to switch positions in the 1-3-1. Cycling players on the weakside not only helps create passing lanes but also makes these players much more difficult to mark.
Conclusions
The Maple Leafs powerplay transitioned their focus away from volume and towards efficiency under Paul McFarland. After having a bit of a rocky start, the Maple Leafs had the second-best PP% in the league once Sheldon Keefe took over as head coach, bringing William Nylander up to the first unit full-time. While a high-volume powerplay may work for some teams, we find that efficiency is far more important for the Leafs given how skilled their top unit is. While we’ve only seen flashes of how dangerous the powerplay can be, it would be interesting to see how this personnel and philosophy would perform over an entire season.